Advanced ATR Correction
When using attenuated total reflectance (ATR) sampling techniques, spectra take on characteristics which are dependent on the angle of incidence of the infrared beam on the ATR crystal, the refractive index of the crystal and the refractive index of the sample. In the ATR technique, the crystal is in contact with the sample. The crystal has a higher index of refraction than the sample, so light will reflect off the surface in contact with the sample. The reflection creates an evanescent wave which penetrates into the sample. Some of the energy of this wave is absorbed by the sample, yielding a spectrum of the sample.
The ATR spectrum of a substance will be different from the transmission spectrum, in which the light passes directly through the sample. The ATR technique changes spectra in two important ways relative to the transmission spectrum of the same substance. The depth of penetration of the evanescent wave is dependent on the wavelength of the light. The effect of this varying depth of penetration is to change the relative peak heights compared to a transmission spectrum. Also, the index of refraction of a sample changes rapidly in the vicinity of an absorption peak, which is referred to as anomalous dispersion. The effect of the anomalous dispersion is to shift the peak from its corresponding location in a transmission spectrum.
Advanced ATR correction removes these effects through application of mathematics that describe the underlying physics. One use of Advanced ATR Correction is to allow library search of ATR spectra against libraries of spectra collected by conventional means. Although there are more ATR libraries available now than in the past, there are still many more non-ATR spectra available in library format.
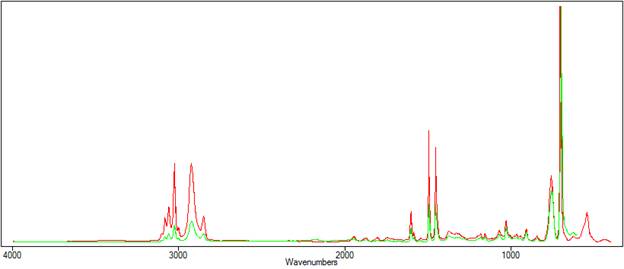
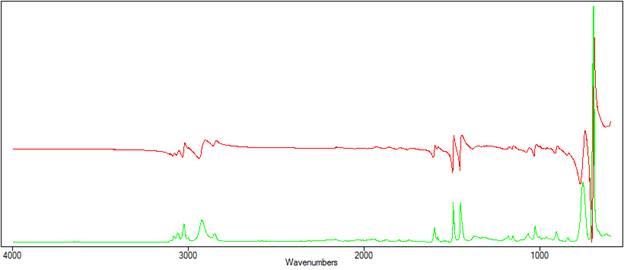
Figure 1 compares the transmission and ATR spectra of polystyrene. The effect of the depth of penetration can be clearly seen, as the ATR peaks diminish in height at longer wavenumbers.
|
| Figure 1. The transmission(red) spectra and ATR (green) spectra of polystyrene. |
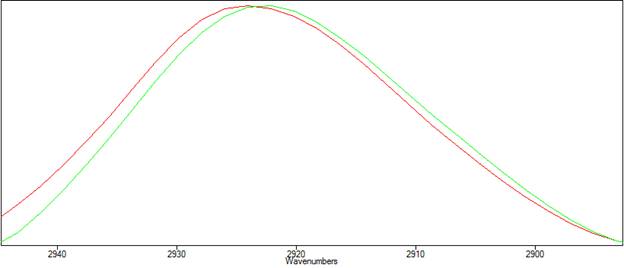
Figure 2 is a view of the same spectra, zoomed in around the 2925cm-1 peak. The shift in peak positions can be seen.
|
| Figure 2. Peak positions in the transmission(red) vs ATR (green) spectra of polystyrene. |
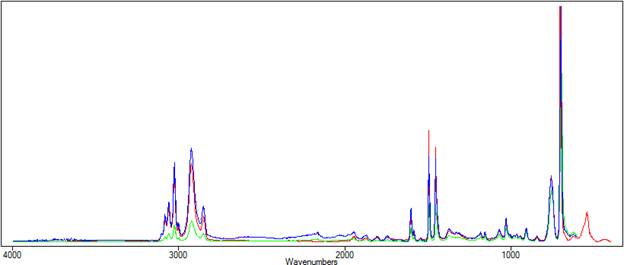
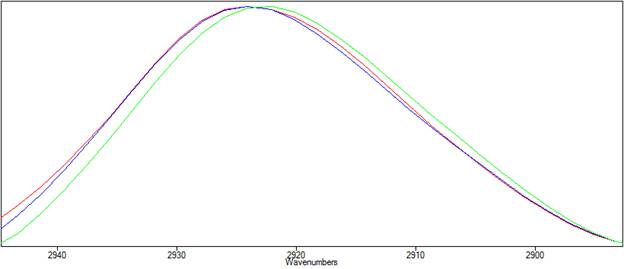
Below, Essential FTIR's Advanced ATR Correction is applied to the ATR spectrum of polystyrene. The resulting spectrum is shown in blue in Figures 3 and 4. In figure 3, the corrected spectrum (blue) now closely matches the transmission spectrum (red). Figure 4 shows that the peak shift has been corrected
|
| Figure 3. The corrected spectrum is shown in blue. |
|
| Figure 4. The corrected spectrum is shown in blue. The peak position now matches the transmission spectrum in red. |
In addition to the corrected absorbance spectrum, Essential FTIR can optionally output the refractive index (n) and absorption coefficient spectrum (k), as shown in Figure 5.
| Figure 5. The k spectrum (green) and n spectrum (red) of polystyrene.
References
'Optical Constants' by John Bertie in the 'Handbook of Vibrational Spectroscopy', John Wiley & Sons, 2002.
'Infrared Intensities of Liquids I', Bertie and Eysel, Applied Spectroscopy volume 39, page 392 (1985).