Baseline Correction
Spectra often need baseline correction before data analysis such as peak picking or library search can be performed.
Automatic Baseline Correction
Many automatic baseline correction techniques have been proposed in the literature. They all rely on estimation of the baseline and then subtraction of the estimated baseline. Essential FTIR implements these automatic baseline correction algorithms:
- 'Function Fit': fits a polynomial of through the spectrum and subtracts that curve from the spectrum.
- 'GIFTS auto-leveling': baseline slope and offset are removed by fitting a straight line to the data and iteratively discarding points that do not fit the line well.
|
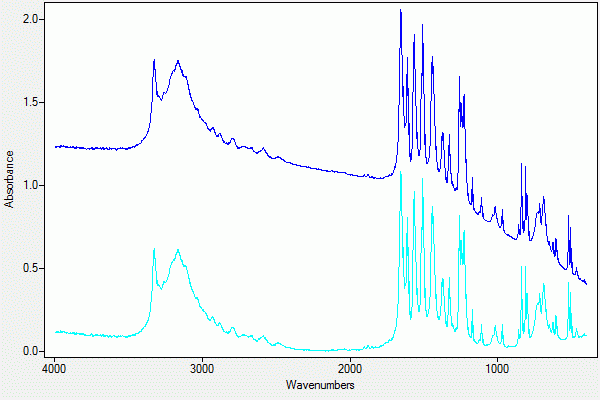
| Figure 1. A sample and the baseline-corrected result using Quintic Function Fit. |
Manual Baseline Correction
Manual baseline correction often yields the best results. In manual baseline correction, the user picks points that define a new baseline. The baseline can be composed of straight line segments between these points, or a smooth cubic spline curve can be fitted through those points. This baseline is subtracted from the spectrum to yield the baseline corrected spectrum.
|
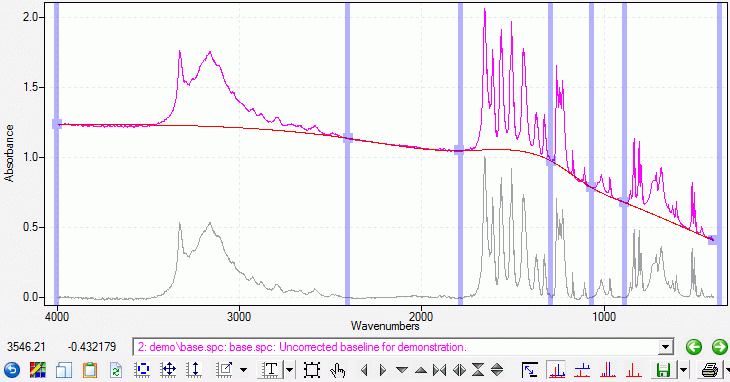
| Figure 2. Points chosen by the user to establish a baseline. |
|
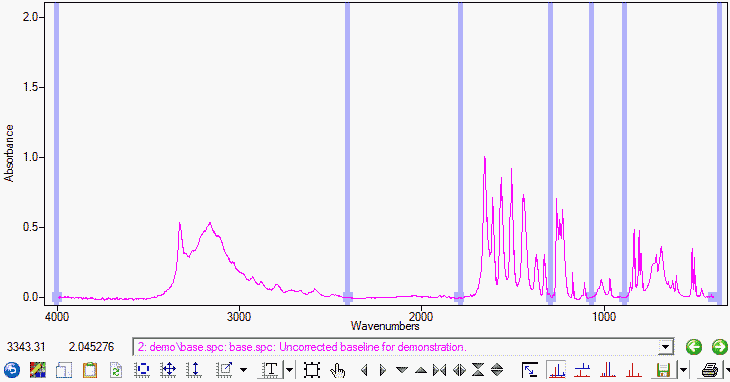
| Figure 3. The Applied Baseline Correction. |
Manual baseline correction often yields better results than automatic correction. The human eye is very good at seeing which points are peaks and which are baseline.
Using a Fitted Baseline as a Background
An advantage of eFTIR's manual baseline correction is that, in addition to baseline correction of a spectrum, the fitted (estimated) baseline can be saved as a separate file. This fitted baseline can be used as a background spectrum to ratio against sample spectra. That is, the fitted baseline can serve as a sample spectrum's own background. This has uses in applications where it is difficult to get a clean baseline spectrum, such as open-path spectroscopy, or samples taken in the presence of water vapor.